Project Summary
Our class of five students was transformed into the Google Nest internal design team. We were presented with a creative brief for a new partnership with Lowe’s Home Improvement stores. We were tasked to research all products to understand their strengths and how they work together. We then shared our research findings and collaborated in a brainstorming session to find the best solution to design the B2B software component.
Each team member developed a tablet software design that solved the business problem we were provided as a class. After the problem was solved, each member of the team wireframed and designed the look and feel of the software, individually resulting in a consumer-facing experience that collected the data for the software.
Objective
As user-focused thinkers and designers, we explore how to think outside of the screen experience and learn how to solve business problems by having empathy for the full user experience. The user's mindset and also the environment can strongly influence how they process information. We problem-solve solutions for both a business-to-business (B2B) and business-to-consumer (B2C) situation, allowing the students to solve how one experience can result in two different solutions.
Research
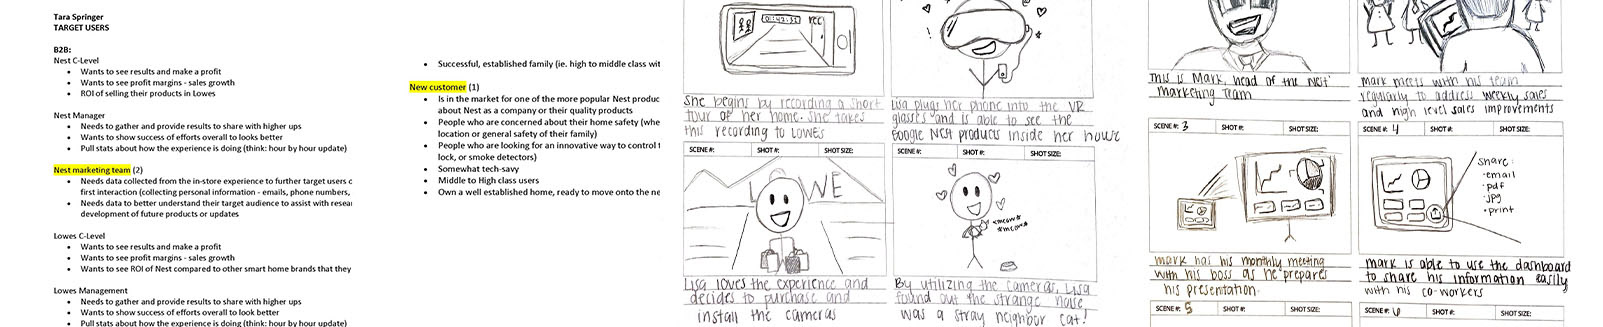
We began the research process by understanding each product that Google Nest provided such as the doorbell, hub, thermostat, etc. Our team developed storyboards for the two main users – the user of the product and the product provider (Google and Lowe's). This allowed us to visualize the process of how our users would interact with the products and compile the data that was being collected through the software.
Ideation and Design
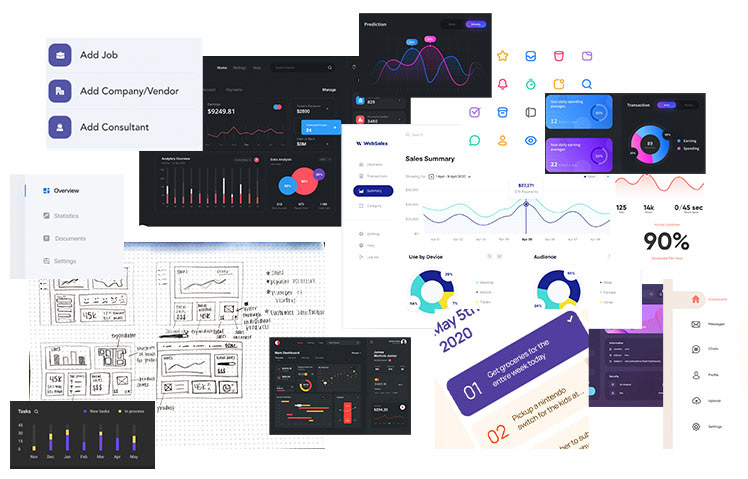
After brainstorming, our team split up and was given the freedom to wireframe and design the software as individuals. I began moodboarding ideas on how to effectively toggle between a variety of products using a navigation and how to display data in a way that can be quickly understood. In search of these solutions, I was able to start wireframing the dashboard of the software.
Wireframes
As shown, the wireframe clicks through the happy flow of the software provided to the Google Nest team. The user is given the option to toggle between the dashboard which houses information such as the sales overview, top locations where products are being sold, individual product revenue, and overall customer satisfaction. Other pages include product pages, in-store experience data, user statistics, and finance/sales.
Design
To conclude the project, I designed a preview of the dashboard display. Choosing a dark mode display with a bright orange highlight color will draw the user's eye to the most important information. This color was is used as a highlight color on most of the Google Nest products. This software is unique due to its advanced filtering style. It allows the user to filter options by date, product, and location which can be beneficial to any large corporation depending on who is utilizing the software and how specific they need to be.
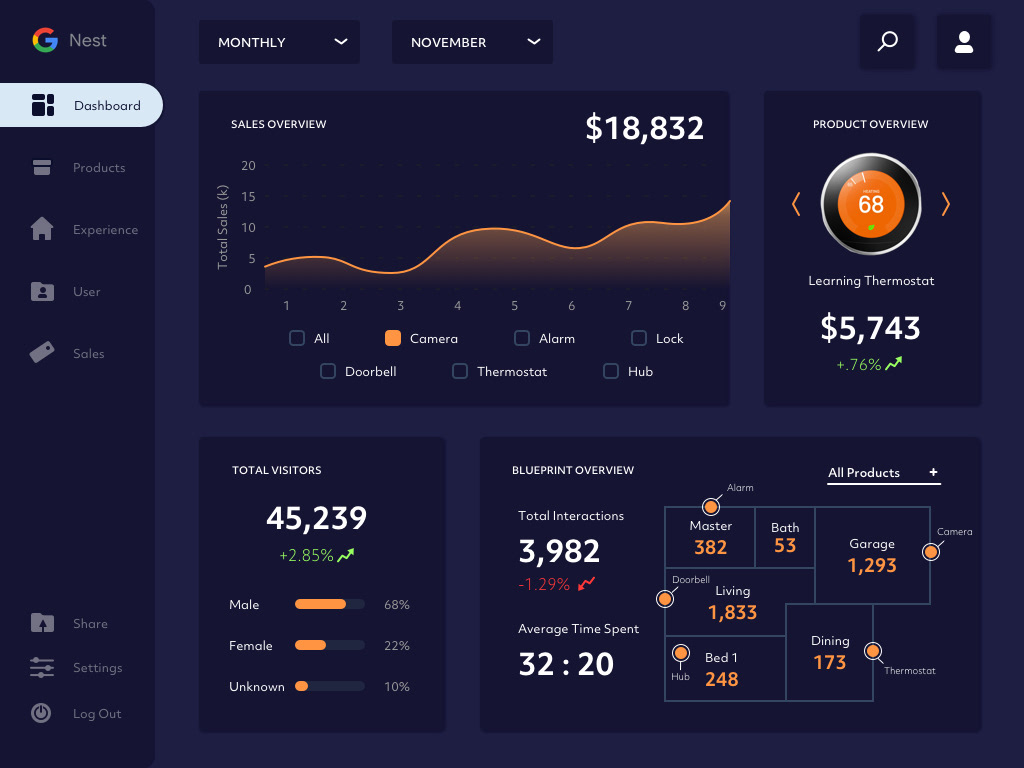
Dormant View
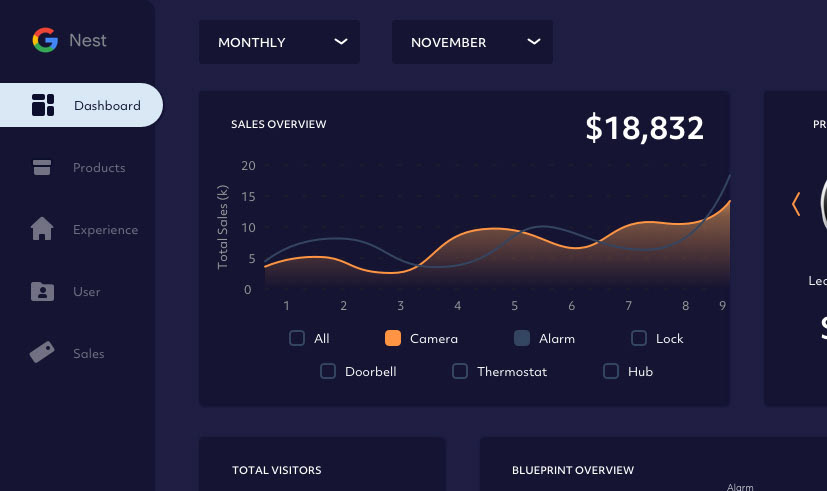
Active View (comparing sales between the camera and the alarm)
My Learnings
This quickly became one of my favorite projects. Visualizing data and working with software was a new learning experience for me, and I loved everything about it. I found data visualization to be fascinating and extremely enjoyable. I loved being able to work as a team to research a complex company and collaborate to create a solution. I enjoyed wireframing and designing individually to observe how everyone's software was designed differently.